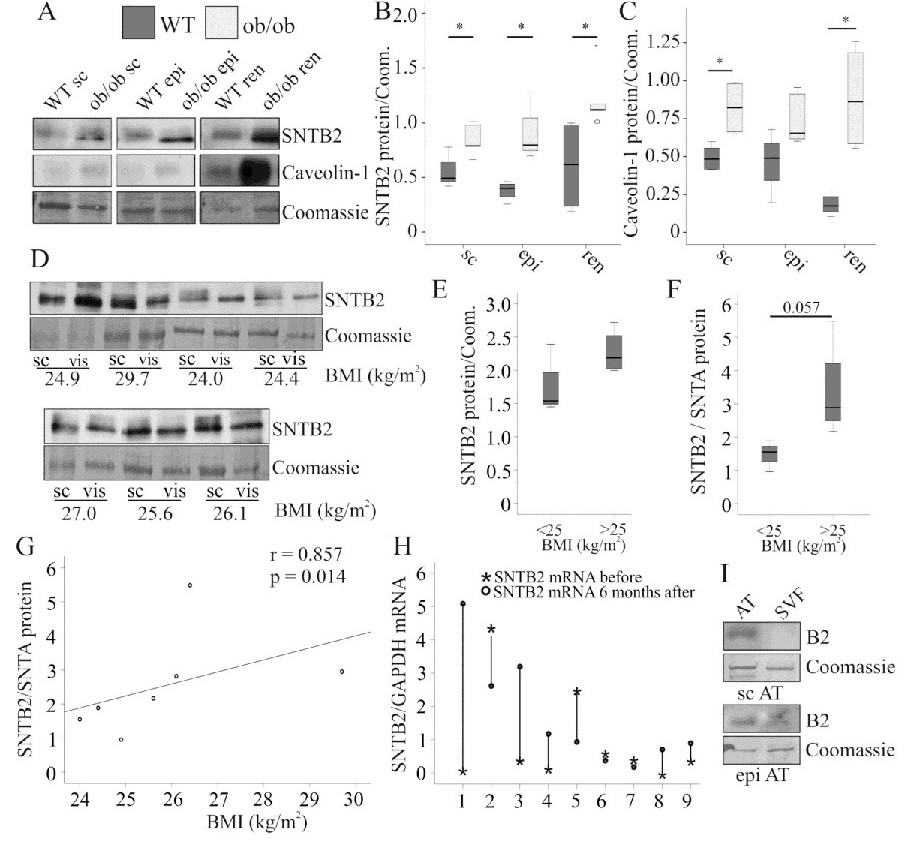
Fig. 6. SNTB2 is induced in fat of ob/ob mice and SNTB2 / SNTA ratio increases with BMI. A. SNTB2 and caveolin-1 in adipose tissues of wild type (WT) and ob/ob mice B. Protein densitometry of SNTB2 in the different fat depots (n = 5 per group). C. Protein densitometry of caveolin-1 in the different fat depots (n = 5 per group). D. SNTB2 in paired samples of sc and visceral fat of 7 patients. Coomassie stained membrane is shown as loading control. The respective BMIs are given below. E. SNTB2 protein in subcutaneous fat of 3 normal weight and 4 overweight patients. F. SNTB2 / SNTA protein ratio in subcutaneous fat of 3 normal weight and 4 overweight patients. G. Correlation of the SNTB2 / SNTA protein ratio with BMI. H. Subcutaneous adipose tissue SNTB2 mRNA in nine very obese patients before bariatric surgery and 6 months later. Subcutaneous, sc; epididymal, epi; perirenal, ren, * p<0.05. I. SNTB2 in adipose tissue (AT) and stromal vascular cell fraction (SVF) of sc and epi fat.